Category: Machine Learning

Yield Curve Interpolation with Gaussian Processes: A Probabilistic Perspective

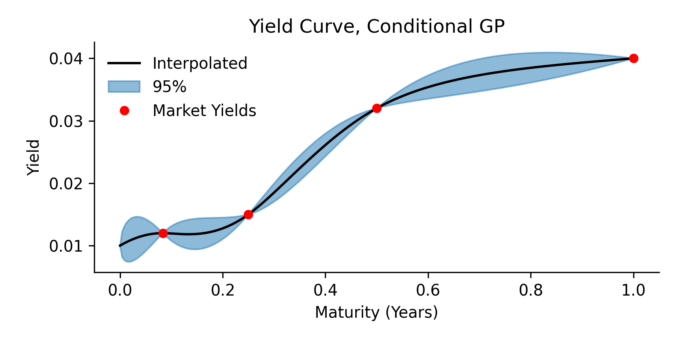
Here we present a yield curve interpolation method, one that’s based on conditioning a stochastic model on a set of market yields. The concept is closely related to a Brownian bridge where you generate scenario according to an SDE, but with the extra condition that the start and end of the scenario’s must have certain values. In this paper we use Gaussian process regression to generalization the Brownian bridge and allows for more complicated conditions. As an example, we condition the Vasicek spot interest rate model on a set of yield constraints and provide an analytical solution.

The resulting model can be applied in several areas:

  • Monte Carlo scenario generation
  • Yield curve interpolation
  • Estimating optimal hedges, and the associated risk for non tradable products
Continue reading

Finding the Nearest Valid Correlation Matrix with Higham’s Algorithm

Introduction

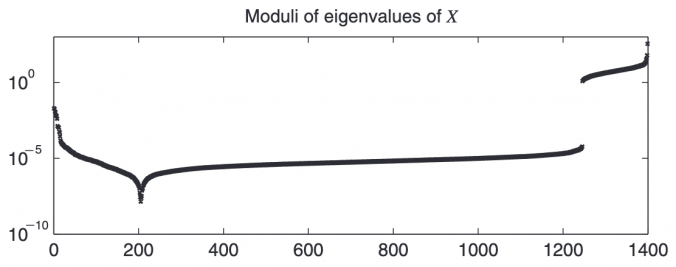
In quantitative finance, correlation matrices are essential for portfolio optimization, risk management, and asset allocation. However, real-world data often results in correlation matrices that are invalid due to various issues:

  • Merging Non-Overlapping Datasets: If correlations are estimated separately for different periods or asset subsets and then stitched together, the resulting matrix may lose its positive semidefiniteness.
  • Manual Adjustments: Risk/assert managers sometimes override statistical estimates based on qualitative insights, inadvertently making the matrix inconsistent.
  • Numerical Precision Issues: Finite sample sizes or noise in financial data can lead to small negative eigenvalues, making the matrix slightly non-positive semidefinite.
Continue reading

Optimal Labeling in Trading: Bridging the Gap Between Supervised and Reinforcement Learning

When building trading strategies, a crucial decision is how to translate market information into trading actions.

Traditional supervised learning approaches tackle this by predicting price movements directly, essentially guessing if the price will move up or down.

Typically, we decide on labels in supervised learning by asking something like: “Will the price rise next week?” or “Will it increase more than 2% over the next few days?” While these are intuitive choices, they often seem arbitrarily tweaked and overlook the real implications on trading strategies. Choices like these silently influence trading frequency, transaction costs, risk exposure, and strategy performance, without clearly tying these outcomes to specific label modeling decisions. There’s a gap here between the supervised learning stage (forecasting) and the actual trading decisions, which resemble reinforcement learning actions.

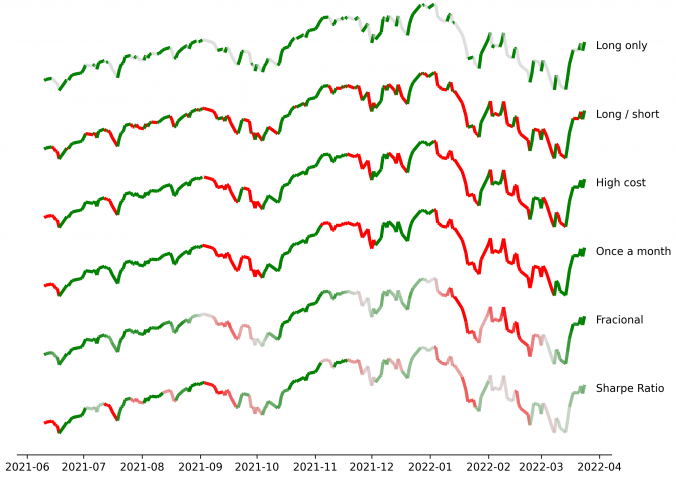
In this post, I present a straightforward yet rigorous solution that bridges this gap, by formulating label selection itself as an optimization problem. Instead of guessing or relying on intuition, labels are derived from explicitly optimizing a defined trading performance objective -like returns or Sharpe ratio- while respecting realistic constraints such as transaction costs or position limits. The result is labeling that is no longer arbitrary, but transparently optimal and directly tied to trading performance.

Continue reading

Parameter Grid-searching with Python’s itertools

Python’s Itertools offers a great solution when you want to do a grid-search for optimal hyperparameter values, -or in general generate sets of experiments-.

In the code fragment below we generate experiment settings (key-value pairs stored in dictionaries) for all combinations of batch sizes and learning rates.

import itertools

# General settings
base_settings = {'epochs': 10}

# Grid search
grid = {
    'batch_size': [32, 64, 128],
    'learning_rate': [1E-4, 1E-3, 1E-2]
}

# Loop over al grid search combinations
for values in itertools.product(*grid.values()):
    point = dict(zip(grid.keys(), values))

    # merge the general settings
    settings = {**base_settings, **point}

    print(settings)

output:

{'epochs': 10, 'batch_size': 32, 'learning_rate': 0.0001}
{'epochs': 10, 'batch_size': 32, 'learning_rate': 0.001}
{'epochs': 10, 'batch_size': 32, 'learning_rate': 0.01}
{'epochs': 10, 'batch_size': 64, 'learning_rate': 0.0001}
{'epochs': 10, 'batch_size': 64, 'learning_rate': 0.001}
{'epochs': 10, 'batch_size': 64, 'learning_rate': 0.01}
{'epochs': 10, 'batch_size': 128, 'learning_rate': 0.0001}
{'epochs': 10, 'batch_size': 128, 'learning_rate': 0.001}
{'epochs': 10, 'batch_size': 128, 'learning_rate': 0.01}
SITMO Machine Learning | Quantitative Finance